Ecommerce analytics: sales, profit, stock and customers, in one view.
Every report an online shop needs, already built and filled with your own data, with competitor prices and Ask Arnie explaining what to do next.
Ecommerce package £500 a month, no limit on online sales. Free until 31 December 2026, then 50% off for life when you join by 31 December.
All your ecommerce and marketing data in one place, including your marketplaces and retail media.
Your store, ad platforms, marketplaces and retail media, stock and competitor prices come together in one view. Start with the whole picture, then drill down into ecommerce, sales, products and customers, marketplaces and marketing.
The usual way
The Armadello way
Every ecommerce report, ready from day one.
These are the reports in the Ecommerce menu today. Each one fills in from the data you connect, such as your store and Google Merchant Centre.
Sales, down to every SKULive
Every order from your store, analysed by product, channel, discount, payment and delivery method, with forecasts set against your targets.
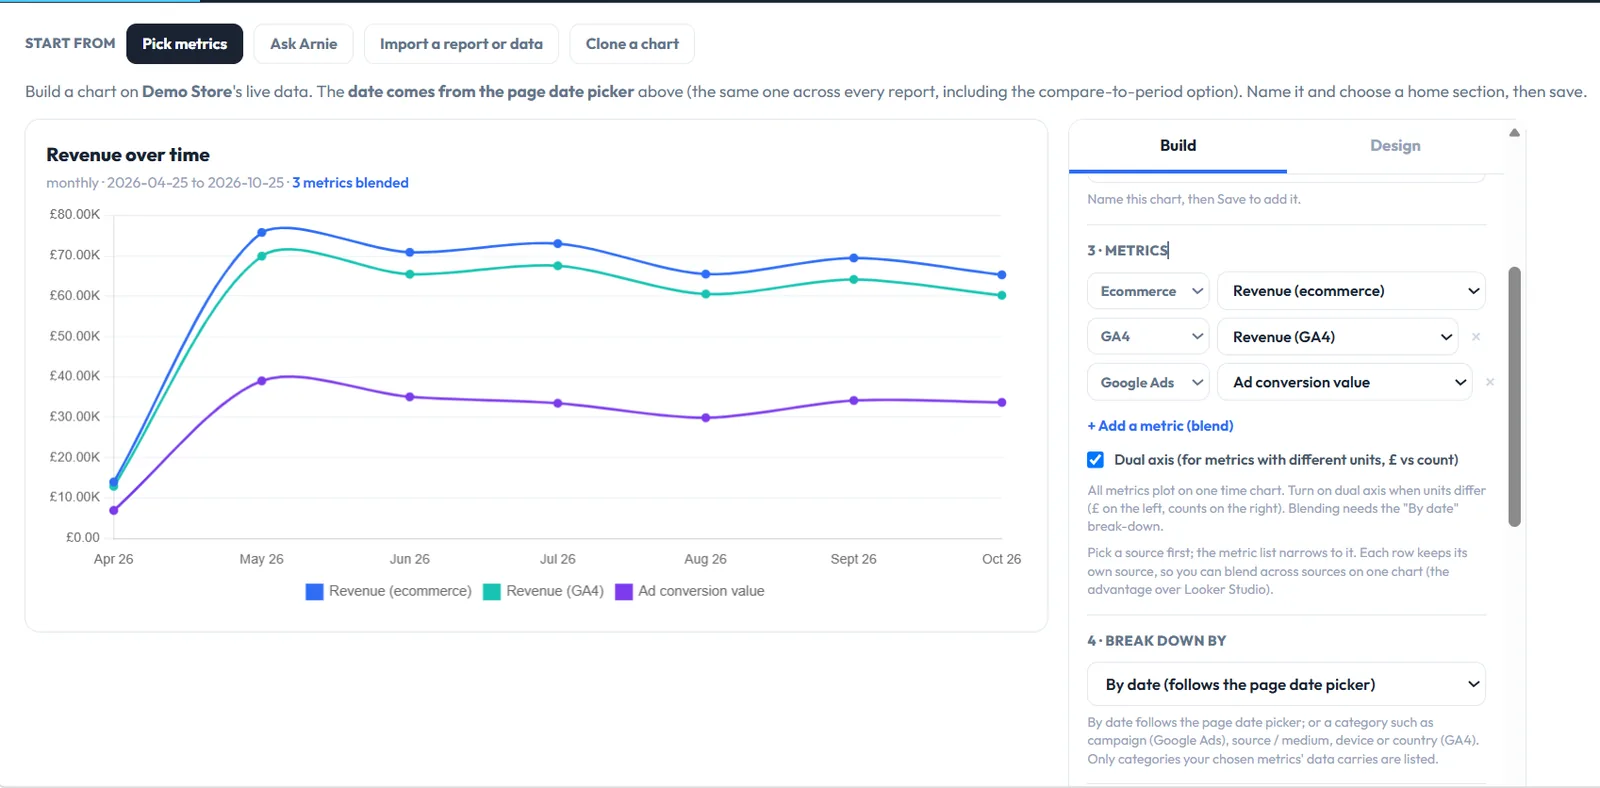
Profit, not just revenueLive
See which products make money once costs are taken off, the return on ad spend each product needs to break even, and which products need attention.
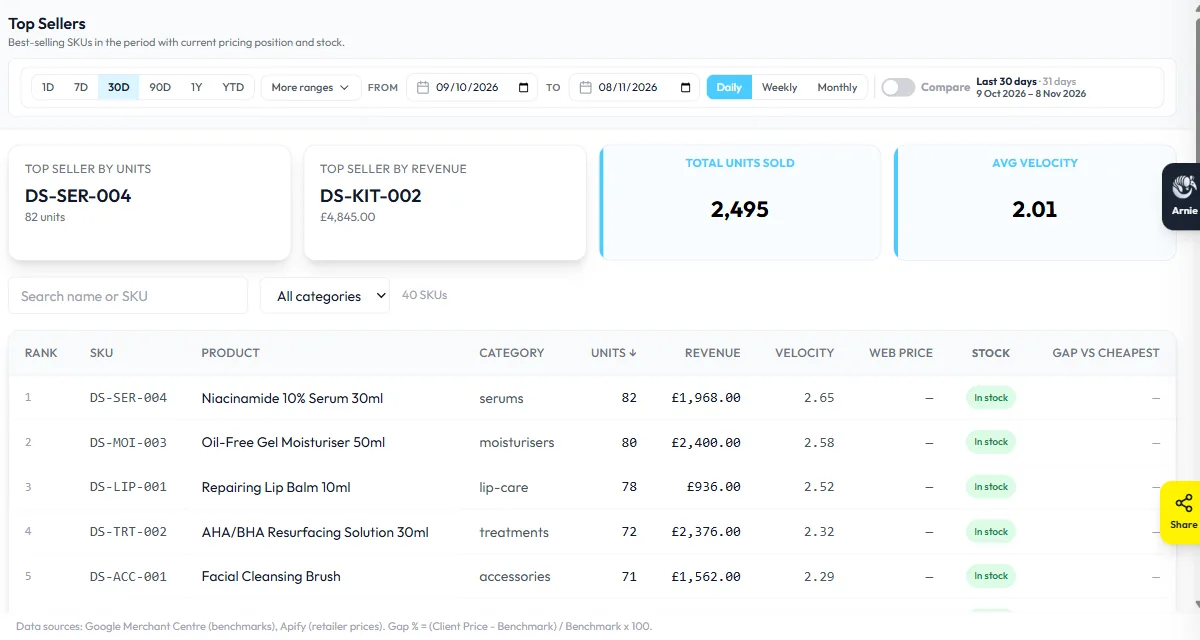
Products and stockLive
Your product data, stock levels and best sellers in one place, with the products that have stopped selling picked out for you.
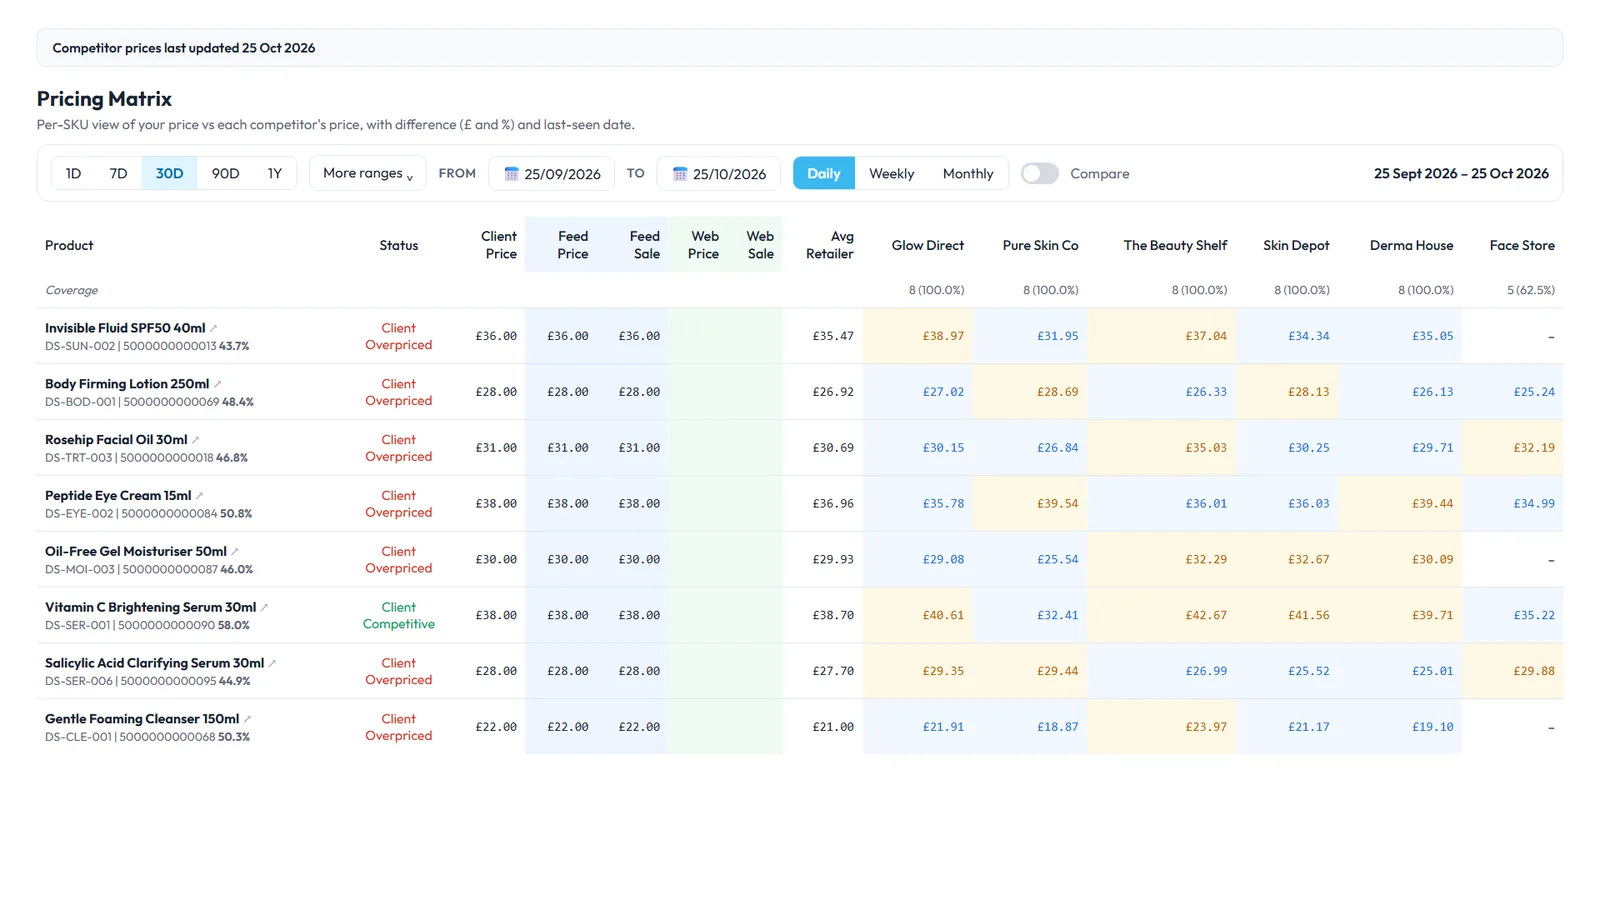
Competitor prices, product by productLive
See where each product sits against competing retailers: above, in line with or below the market. The Ecommerce package checks 500 products; add more products, or check more often, as an add-on.
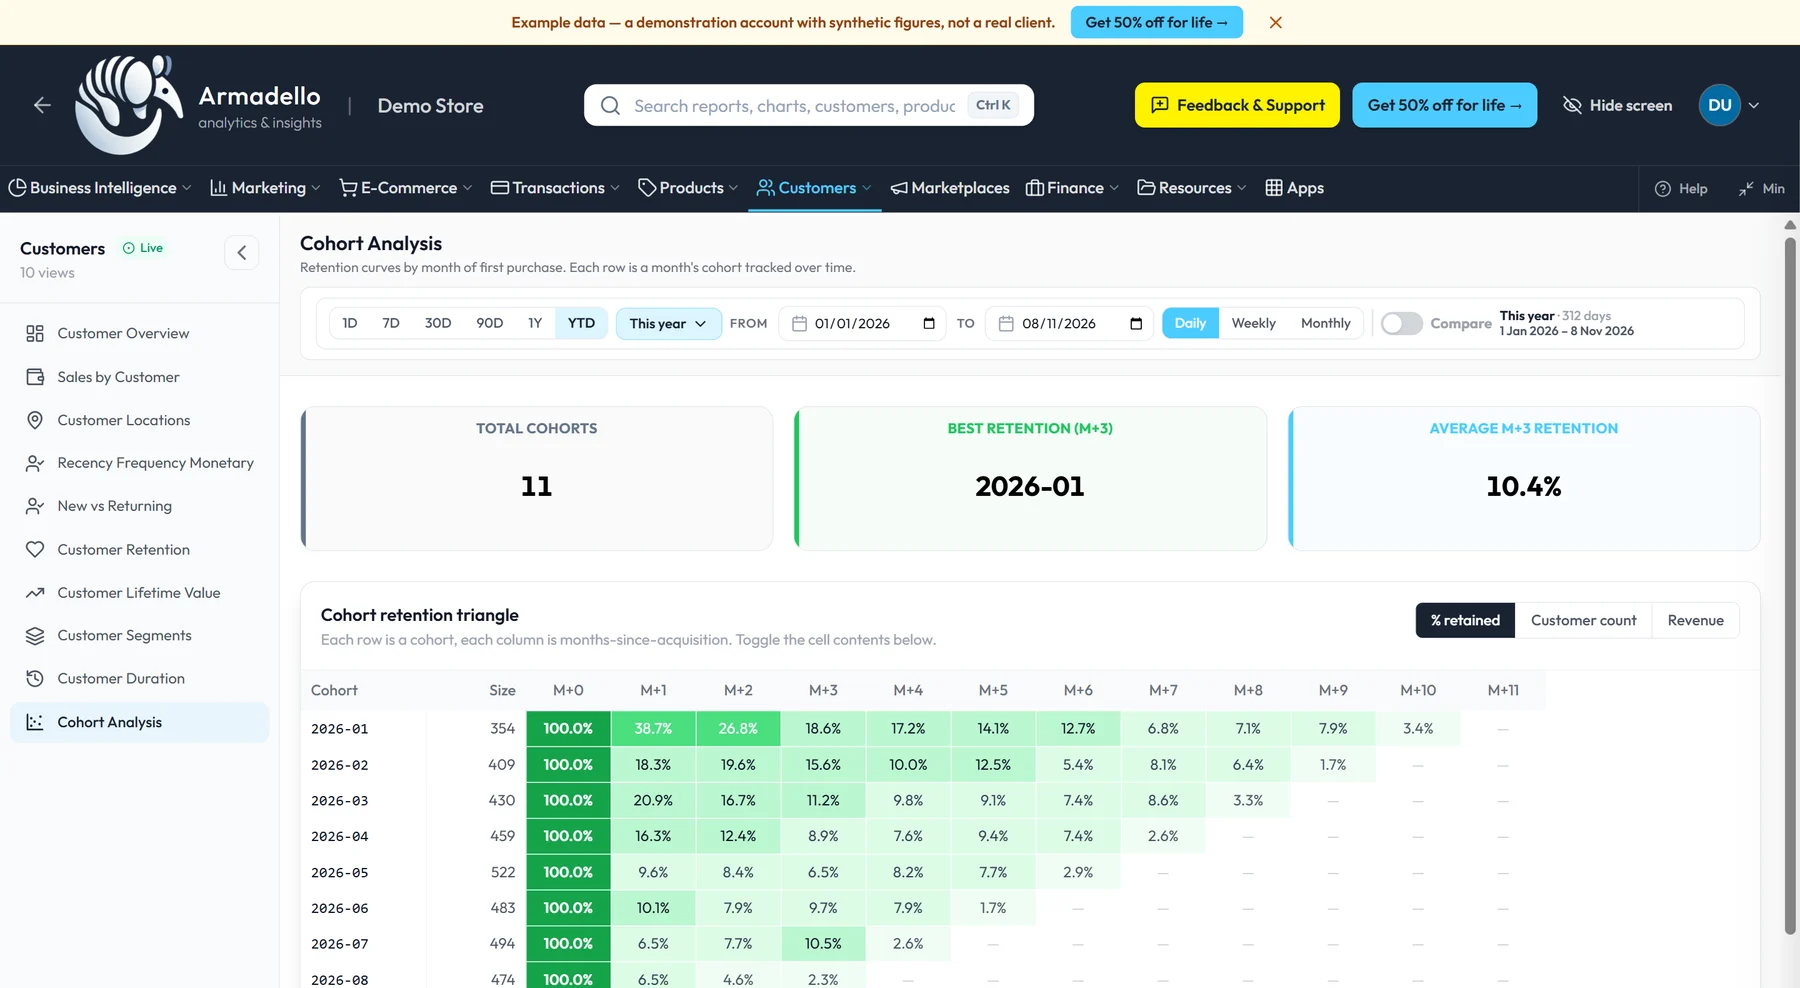
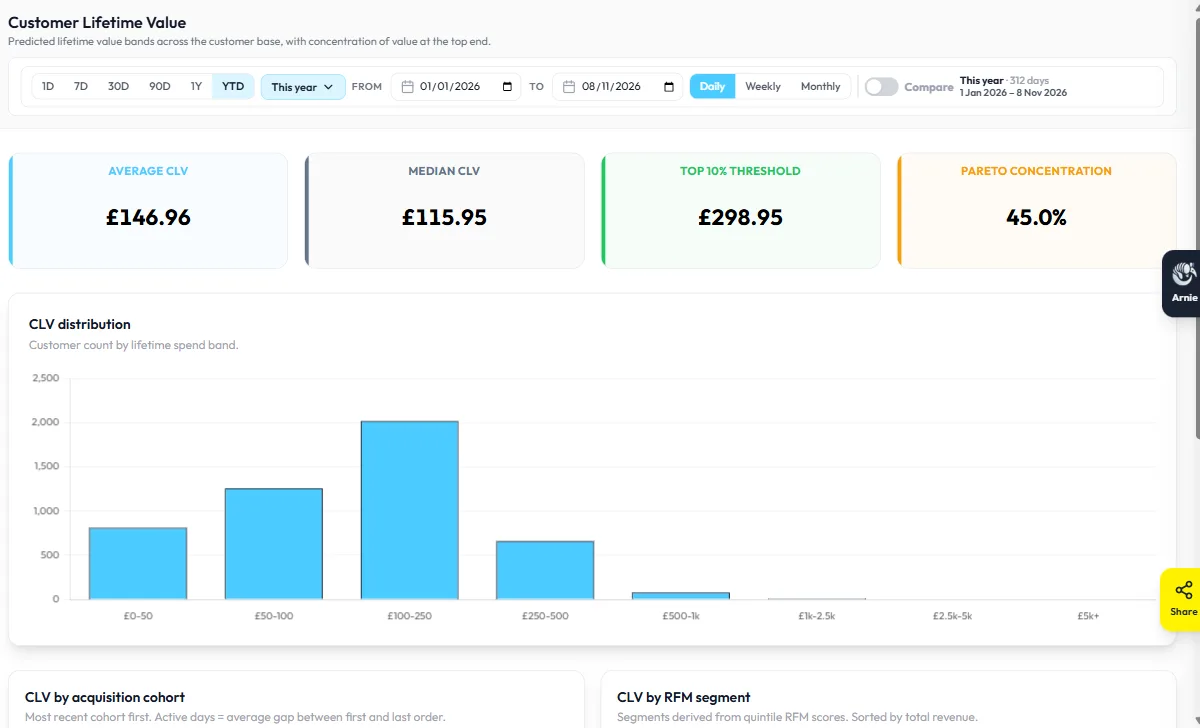
Customers, and what they are worthLive
Who buys, where they are, how often they come back and what each customer is worth over time.
Your store and Merchant Centre
Shopify, Magento, WooCommerce or BigCommerce, with Google Merchant Centre. Each report fills in from the data you connect.
Set up with you
We connect your data for you on a live call, so you do not have to find your own API keys.
Alerts, daily or weekly
Hear about changes in sales, traffic and other figures, as often as you choose.
The full list, as it appears in the app.
Each report fills in from the data you connect, such as your store and Google Merchant Centre.
E-CommerceLive
- OverviewHeadline revenue, orders, average order value and ad return
- Sales overviewHeadline sales figures across all channels
- Forecasting and targetsSales forecast set against budget and actual
- Sales analysisSales by product, sales by category and sales trends
- Product healthWhich products sell, which get spend and do not sell, which get neither
- ProfitabilityMargin bands, category value and margin erosion
- ROAS and breakevenThe return on ad spend each product needs to break even
- SKU performanceRevenue, cost and ad return for every product
TransactionsLive
- Payment methodsSales split by payment method
- Shipping methodsSales split by shipping method and carrier
- DiscountsPromotion code use, discount value and the effect on margin
- RefundsRefund overview, refunds by reason and refund trends
- Returns analysisReturn rates by product and reason
- Orders tableEvery order, searchable, with status, value and customer
Products and competitor pricesLive
- OverviewPrice gaps against competitors, by category
- Product data sheetEvery field held for every product
- Stock levelsStock by category, with low-stock alerts
- Dead stockHigh stock and few visits: candidates for clearance
- BenchmarkEvery product against the competitor benchmark
- TrendsPrice history from the competitor price checks
- Pricing matrixYour price against each competing retailer
- Overpriced and underpricedProducts above or below the market
- Retailer summaryDetail for each competing retailer
- Request a scrapeOrder fresh competitor prices: products and frequency
- Top sellersBest sellers by units, revenue and speed of sale
- Product categoriesSales and stock grouped by category
CustomersLive
- Customer overviewTotal, new and returning customers, average spend
- Sales by customerTop spenders and biggest accounts
- Customer locationsWhere customers are, by postcode and region
- Recency, frequency, monetary (RFM)Champions, loyal, at risk and lost segments
- New vs returningOrders and revenue from first-time and returning customers
- Customer retentionRepeat purchase rate and lapsed customers
- Customer lifetime valueValue per customer, segment, channel and cohort
- Customer segmentsNamed groups and behaviour-based groups
- Customer durationHow long customers stay active
- Cohort analysisRetention and revenue by month of first order
Marketplaces
- Amazon AdvertisingLive: Amazon ad performance next to your other channels
- Marketplace sales with website salesIn development: profit per product on every channel
Data is the first step. The value is knowing what to do.
Most owners do not have the time to read every report. They miss the drop in a best-selling product, the wasted spend, the price a competitor cut.
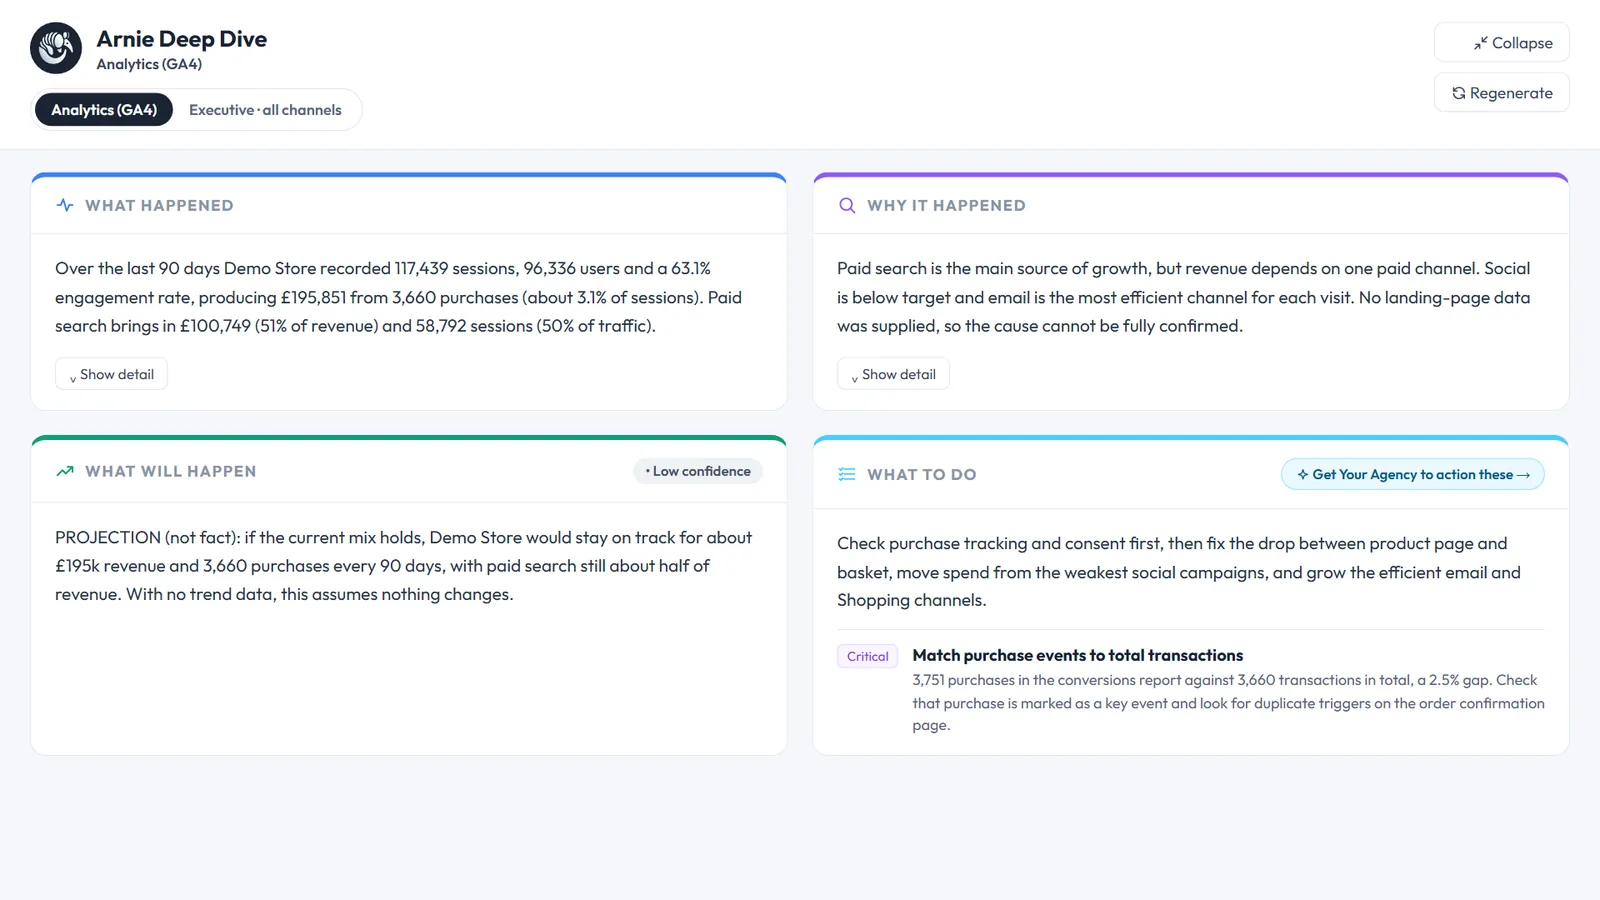
Ask Arnie, the AI analyst
Arnie sets out what happened, why, what is likely to happen next and what to do about it, with a £ value on each recommendation. You decide what happens next.
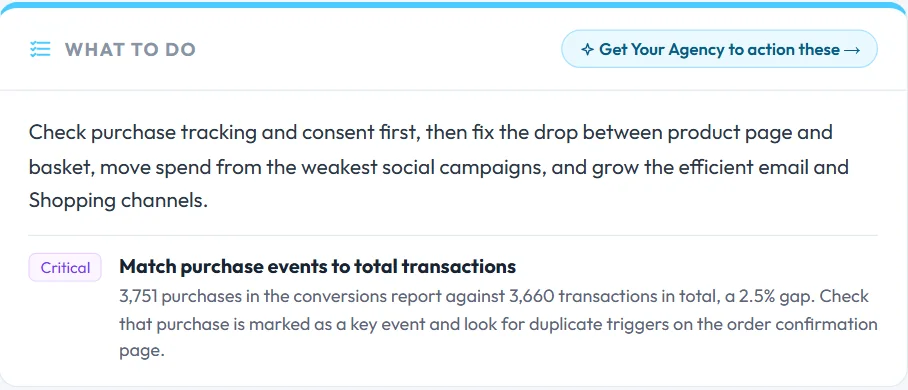
A button to get the work done
Advice that nobody carries out is wasted. A button sends the recommendation to whoever should do it: your agency, or our specialists if you do not have one.
Use your data in your own AILive
Through the Armadello MCP server, Claude, ChatGPT or your PPC tool can work on your Armadello data in the tools you already use.
Marketplaces next to your websiteIn development
Marketplace sales joined with your own website sales, with profit per product on every channel.
Our own attribution pixelIn development
One view of which ads caused each sale, instead of Google, Meta and GA4 each claiming it. Part of the FiMO business suite.
Marketing mix modellingIn development
Google Meridian, for the channels a pixel cannot see. Part of the FiMO business suite.
Looking at other ecommerce analytics tools?
Online retailers often look at these tools too. For each one we set out what it covers, how it is priced and how it differs from Armadello.
For the people who run the trading.
“Which products and channels really make money, and what are competitors charging?”
No limit on online sales. You move up to the FiMO business suite when you want finance, our attribution pixel and marketing mix modelling in the same view, not because you have grown.
See your own ecommerce data in Armadello.
Book a live demo and we will walk you through the platform, then connect your data with you on a live call. Free until 31 December 2026, then 50% off the Ecommerce package for life.